Six figures putting all three models on one pair of axes, plus the scripts that build them. The study is written up in SUMMARY.md, which reads them in order; the per-question detail behind them is in QUESTIONS.md. Both also exist as self-contained HTML — SUMMARY.html and QUESTIONS.html, with the figures embedded and nothing to resolve — rebuilt by uv run python results-cross/build_html.py.
| Figure | Shows |
|---|---|
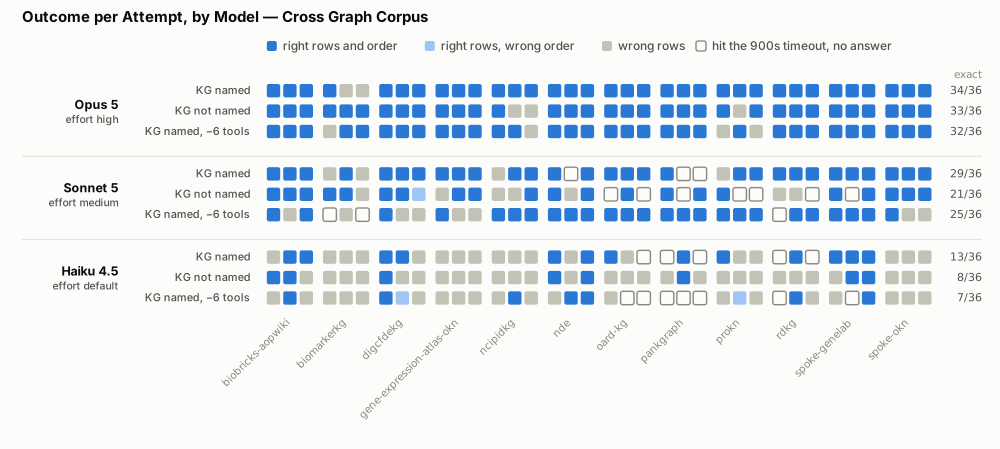
outcome-by-model.svg | what each attempt produced — right rows and order, right rows in the wrong order, wrong rows, or nothing |
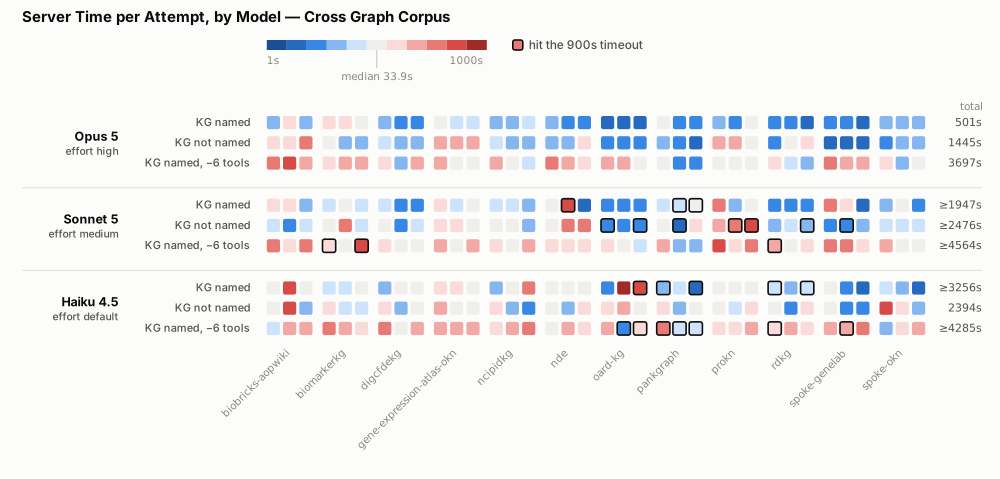
server-time-by-model.svg | seconds each attempt spent inside the server under test |
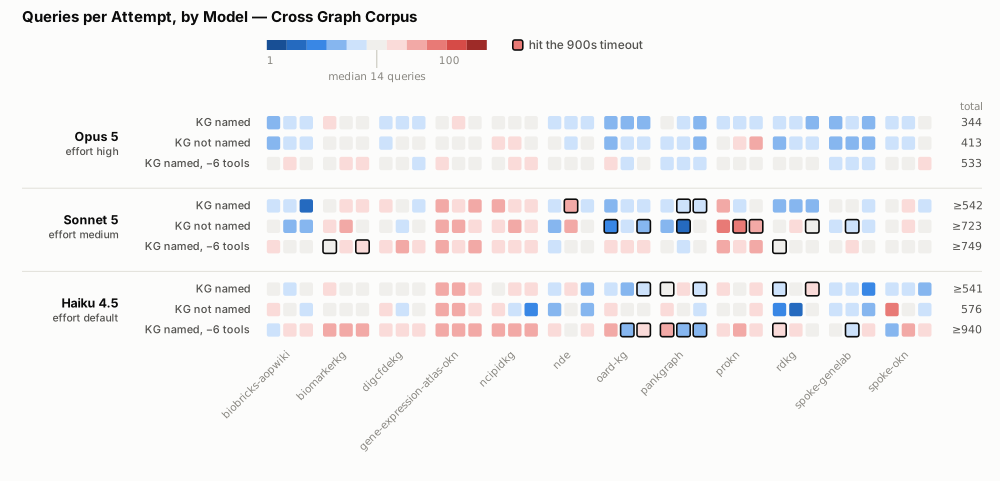
queries-by-model.svg | how many queries each attempt ran |
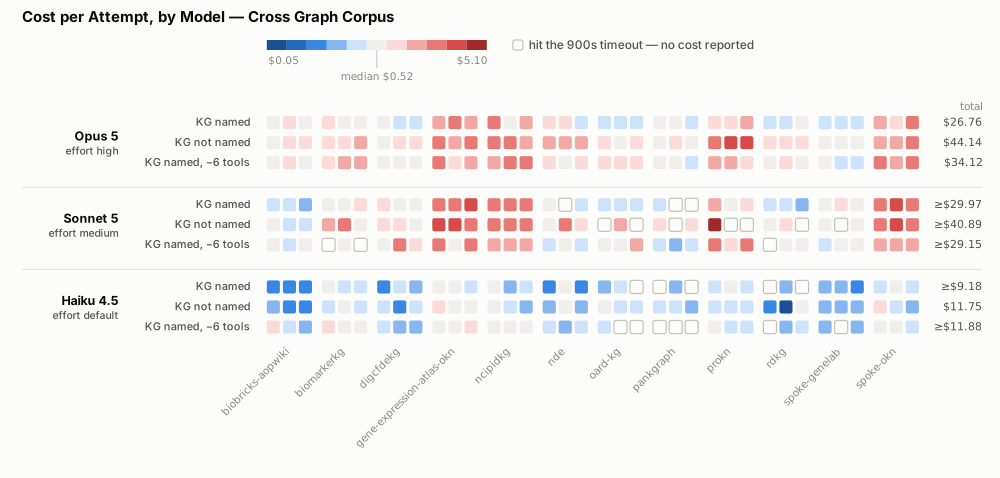
cost-by-model.svg | what each attempt cost, in US dollars |
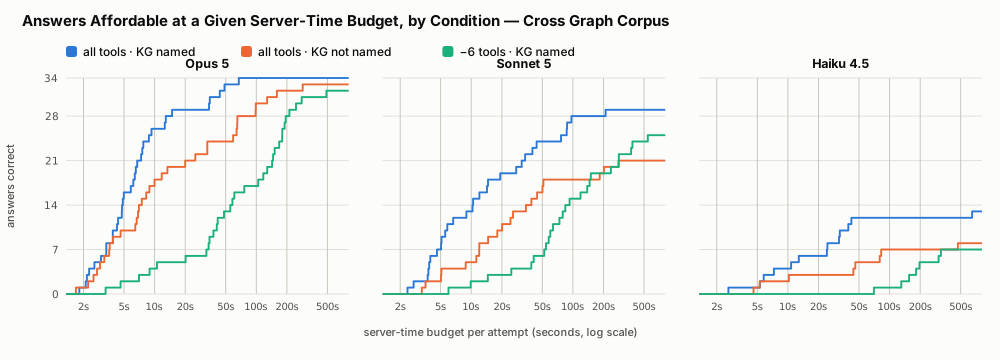
budget-panels-by-server-time.svg | how many answers each arm could still afford at a given endpoint budget |
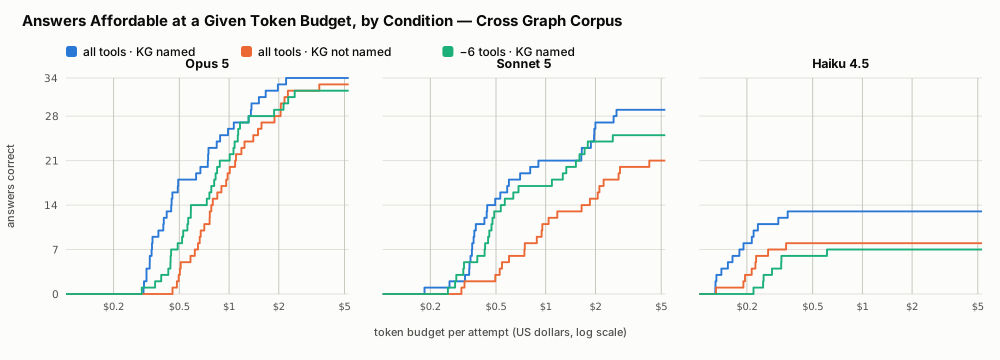
budget-panels-by-cost.svg | the same, with tokens as the scarce resource |
The first four share one layout, so any two can be compared square for square. The two budget figures are a different idiom and are described below.
Rows are the nine arms — three models, each banded into its three conditions, in the order KG named, KG not named, KG named −6 tools. The fully-equipped arm leads because it is the baseline the other two are measured against.
Columns are the twelve questions, three squares each: one per attempt, left to right.
Shading on the three quantitative figures is logarithmic and diverging about the median attempt: blue is below typical, red above. The neutral midpoint is the median of the whole figure and the legend states its value. This encodes deviation rather than raw magnitude, which is what makes an outlier visible in a grid of 324 squares; the ramp's two ends still carry their absolute values.
A heavy outline marks an attempt killed at the 900s agent timeout. On outcome-by-model such an attempt is drawn hollow instead — it produced no answer, so there is no outcome to color. On cost-by-model it is blank: the agent host writes agent.json only on a clean exit, so no price was ever reported. It is left blank rather than shaded at the pale end, which would read as "cheap" when it means "unknown, and certainly not free".
The right-hand column totals each row over all 36 of its attempts. A total marked ≥ contains a killed attempt and therefore understates — and it understates most in the arms that struggled most, which is the misleading direction. On outcome-by-model the column is a tally of exact attempts instead, and carries no ≥: a killed attempt is definitively not exact, so the count is exact even where the sums are only bounds.
Every square has a tooltip naming the model, arm, question and value.
The row totals here are sums over all 36 attempts of an arm. The Server and Queries columns in each root's generated README.md are one pass — the per-question mean summed over twelve questions — so they are roughly a third of these. Neither is wrong; they answer different questions. Do not put them in the same table.
Each figure exists as .svg and .png. The SVG is the source of truth — sharper at any zoom, a fifth of the size, and what build_comparison.py writes. The PNGs are rendered from it at 2× (2000px wide) for venues that will not take SVG: manuscript submission, Word, PowerPoint. SUMMARY.md links the PNGs so it stays portable into those tools; the table above links the SVGs.
All six are hand-built. The harness renders one runs root at a time and cannot draw three models on one pair of axes, so nothing regenerates them automatically:
uv run python results-cross/build_comparison.pyThe script reads the three roots directly and writes all six figures. To refresh the PNGs afterwards:
./results-cross/build_png.shIt renders each SVG through headless Chrome — the same engine the figures were designed against — so the PNG shows what a reader sees in the browser. Set SCALE=3 for a higher-DPI render. Re-run it after any run, rescore or report that changes a root, or the figures will quietly disagree with the tables they sit beside.
It shares its palette, ramp, layout and timeout conventions with the harness's own figure code (src/okn_benchmark/figure.py), which is what keeps a comparison figure readable straight after a per-root one.
build_budget.pyRe-reads the recorded episodes under a resource budget and writes the section 9 tables to stdout as markdown. It needs no model, no endpoint and no network: the budgets are applied to runs that already exist, so an episode counts only if it was correct and stayed inside the cap.
uv run python results-cross/build_budget.py
It refuses to print if any correct episode is missing its recorded cost. The section's claim that these numbers are not lower bounds rests on timeout-killed episodes producing no answer and so never entering a numerator; a silent hole would look exactly like a result.
The tables it prints are three-dimensional — model × arm × budget — which is why the section's two figures are small multiples rather than one pair of axes; see How to read the budget figures.
The computation lives in okn_benchmark.budget and is tested; this script only declares the table shape. results-ontology/ and results-single/ have their own, which drop the arm dimension because those corpora have a single condition.
The grids put one square per attempt, which cannot show a sweep: a budget is a continuous axis, not a condition. The two budget-panels-* figures are that other view. One panel per model, all six sharing a pair of axes so a difference in shape is a difference in the data rather than in the scale. Each line steps up once per correct answer, ordered by what that answer cost, and flattens at that arm's uncapped total — so a point reads at this budget per attempt, this arm would still have got this many right.
There are two because there are two scarce resources, and the arms rank differently in each: the ablated arm lags badly on endpoint time and hardly at all on tokens, while the KG-not-named arm does the reverse. Section 9 of SUMMARY.md reads them.